Posted on

Trellows Property Market Update – Cambridgeshire July 2023

Trellows Property Market Update – Cambridgeshire July 2023

**House Prices in Cambridgeshire: A Look at the Market Trends**

Cambridgeshire, known for its prestigious universities, picturesque countryside, and vibrant cities, has become a desirable location for property buyers and investors. As the region continues to attract people from all walks of life, let’s take a closer look at the current house prices in Cambridgeshire and the trends that have shaped the market over the last year.

**Overall Average Price**

Over the past year, properties in Cambridgeshire had an overall average price of £376,949. This figure encompasses various types of properties, ranging from detached houses to flats, and provides a general understanding of the region’s property market.

**Detached Properties**

Detached properties have dominated the market in Cambridgeshire, with the majority of sales falling under this category. The average price of a detached house in the region was £515,434 over the last year. These spacious and independent homes have proven to be popular among buyers seeking privacy and ample living space.

**Semi-Detached Properties**

Semi-detached properties, another sought-after choice for families and first-time buyers, had an average selling price of £338,312. These homes offer a good compromise between affordability and space, making them a practical option for many buyers.

**Terraced Properties**

Terraced properties, often offering a charming and compact living space, had an average selling price of £306,726 in Cambridgeshire. These homes can be a great choice for buyers seeking a sense of community and a central location.

**Market Trends**

The property market in Cambridgeshire experienced significant growth over the last year. Sold prices were 7% higher compared to the previous year, showcasing a strong demand for properties in the region. Moreover, prices were up by an impressive 14% when compared to the 2020 peak of £330,837, indicating a sustained upward trend in property values.

**Noteworthy Sales**

Let’s take a look at some notable property sales in Cambridgeshire:

Date sold Property Address Property Type Sale Price (£) Tenure
23 May 2023 25, The Oaks, Soham, Ely, Cambridgeshire CB7 5FF Detached £625,000 Freehold
19 May 2023 93, Appletrees, Bar Hill, Cambridge, Cambridgeshire CB23 8SW Detached £430,000 Freehold
19 May 2023 17, Star Lane, Ramsey, Huntingdon, Cambridgeshire PE26 1JJ Detached £295,000 Freehold
19 May 2023 4, Vicarage Close, Oakington, Cambridge, Cambridgeshire CB24 3AN Detached £475,000 Freehold
19 May 2023 Flat 4, The Grange, 65, High Street, Somersham, Huntingdon, Cambridgeshire PE28 3JB Flat £105,000 Leasehold
19 May 2023 15, Westhawe, Bretton, Peterborough, City Of Peterborough PE3 8BA Detached £573,000 Freehold
18 May 2023 25, Vicarage Way, Trumpington, Cambridge, Cambridgeshire CB2 9NT Detached £840,000 Freehold
17 May 2023 44, Roman Way, Godmanchester, Huntingdon, Cambridgeshire PE29 2RW Terraced £310,000 Freehold
17 May 2023 17, Weddell Road, Haverhill, Suffolk CB9 0LE Detached £330,000 Freehold
17 May 2023 8, Malting Yard, Ramsey, Huntingdon, Cambridgeshire PE26 1DL Flat £130,000 Leasehold
17 May 2023 9, Atkinson Street, Peterborough, City Of Peterborough PE1 5HW Terraced £180,000 Freehold
17 May 2023 29a, Woodpecker Way, Great Cambourne, Cambridge, Cambridgeshire CB23 6GZ Semi-detached £170,000 Leasehold
16 May 2023 37, Listers Road, Upwell, Wisbech, Norfolk PE14 9BW Detached £325,000 Freehold
16 May 2023 1, Osprey Road, Biggleswade, Central Bedfordshire SG18 8DZ Terraced £315,000 Freehold
16 May 2023 15, Bridge Road, Bedford MK42 9LJ Semi-detached £260,000 Freehold
16 May 2023 16, School Road, Terrington St John, Wisbech, Norfolk PE14 7SE Semi-detached £140,000 Freehold
16 May 2023 64, Ross Close, Saffron Walden, Essex CB11 4AY Flat £265,000 Leasehold
15 May 2023 10, Payton Way, Waterbeach, Cambridge, Cambridgeshire CB25 9NS Semi-detached £395,000 Freehold
15 May 2023 8, Mill Road, Impington, Cambridge, Cambridgeshire CB24 9PE Semi-detached £575,000 Freehold
15 May 2023 424, March Road, Turves, Peterborough, Cambridgeshire PE7 2DW Semi-detached £165,000 Freehold
12 May 2023 22, Granta Terrace, Great Shelford, Cambridge, Cambridgeshire CB22 5DJ Terraced £525,000 Freehold
12 May 2023 161, Padholme Road, Peterborough, City Of Peterborough PE1 5JA Detached £240,000 Freehold
12 May 2023 3, Pattens Close, Whittlesey, Peterborough, Cambridgeshire PE7 1FA Semi-detached £260,000 Freehold
12 May 2023 291, Arbury Road, Cambridge, Cambridgeshire CB4 2JL Detached £575,000 Freehold
12 May 2023 9, Hartley Close, Waterbeach, Cambridge, Cambridgeshire CB25 9NG Semi-detached £288,000 Freehold


These sales illustrate the diversity of properties available in Cambridgeshire and the varying price points in the region.

**Conclusion**

Cambridgeshire’s property market has seen impressive growth over the last year, with detached properties leading the way in terms of popularity and price. As the region continues to attract residents and investors alike, it remains an area of interest for those looking to purchase a property. Whether you’re searching for a spacious detached house or a cozy terraced home, Cambridgeshire offers a range of options to suit different preferences and budgets.
 

Posted on

What next for the property market in Northamptonshire

What next for the property market in Northamptonshire

What next for the property market in Northamptonshire


It’s been quite a worrying time over the last few weeks, with all different factors coming together to ring alarm bells for the over-heating property market, but what is the situation in Northamptonshire and should you hold-off on any plans to move?

Despite the fact that there will invariably be some sort of correction for the sought after pockets that clearly achieved unrealistic prices over the last year or two, for the main part, Northamptonshire has not experienced any unrealistic prices, but even so, there may still be some downward pressure. The direction of interest rates has recently been upwards, but where they will peak is still unclear, as the effects of the existing rises is yet to filter through in to statistics on final selling prices.

One thing is for certain, the property market is much more sensitive to rises today, than it was in the past, therefore exponential rises will probably not be needed to slow things down significantly, but even so, due to the large volume of property that has been bought up by investors over the last decade or two, there is still a significant shortage of entry level property, coming to market, as investors tend to hang on to their properties long-term, whereas homeowners tend to move every 5/6 years.

Even though there has been a significant number of landlords exiting the Buy to Let market over the last few years, those properties have easily been taken up by first-time-buyers and larger investors, who are still buying in large quantities, such as Lloyds Bank, who announced that they plan to be the UKs largest landlord by 2025.

Therefore, first time buyers who are savvy, should use the forthcoming year to bag themselves a bargain, provided that their figures stack up in the short term, until rates begin to come down again, which they will, we need only look at the 5 year terms that lenders are offering, which are cheaper than their 2 year deals on average, which indicates that they expect interest rates to begin falling after the end of year two, otherwise they would not offer them in the first place.

As for home-movers, a falling market is not a time to wait, for the main part, it is actually a good time to consider moving up, as any fall in prices is normally by percentage and therefore, the higher the price, the greater the fall, which could translate in to maybe taking an offer on your own home, but you would be making a larger saving on the next property, resulting in a material gain.

The most important factor that applies over the next year or two, is to ensure that you are able to cover any rise in interest rates, which may require some sacrifices, but with Northamptonshire being a booming county, with far more jobs available than there are candidates, there is no reason for any short term fall, not to be out-weighed by gains in the medium to long term.

Posted on

What is happening to the UK property market

What is happening to the uk property market

What is happening to the UK property market

Whether you’re applying for your first mortgage, or you’re already a homeowner, you’ll know there’s a lot of news coverage about interest rates, inflation and mortgage loans right now. 

So what’s happening, and why? How it might affect you will depend on what type of mortgage deal you’re looking for, or the type of deal you’re on – and how much longer is left on the term of your loan. 

Plus, forecasts on rising interest rates are changing quickly, along with wider economic conditions. No one knows for sure what’s ahead, but we’re still seeing tens of thousands of people requesting to view properties each day, which is the same level that we’ve seen all month.

So if you are thinking of moving, or if your mortgage term is coming to an end soon, here we’ve tried to help answer some of the questions you might have. 

Why are mortgage rates rising now?

Before this week, mortgage rates had already been increasing throughout the year. The Bank of England sets the ‘base rate’, which lenders use to set their own mortgage rates. In January of this year, the base rate was 0.25%. Since then, it has gone up incrementally and is currently 2.25%. 

The Government sets the Bank of England an inflation target of 2%, but the current rate is 9.9%. It’s the Bank of England’s responsibility to make sure inflation is low and stable, so they need to bring inflation back down. The way they do that is by increasing interest rates. 

The Bank of England forecasts inflation to rise to about 11% in October, and that it will stay above 10% for a few months before starting to fall. 

Rising interest rates have led to an increase in the average mortgage rates that are available. As an example, if you have a 10% deposit and choose to take out a two-year fixed rate mortgage, the typical rate that was available in January was 2%. That increased to an average of 3.9% at the end of August. These rises had been predicted and lenders were able to factor them in gradually. 

Mortgage rates have been rising further this week because when unexpected things happen in financial markets, they’re likely to have a direct impact. Last Friday (23rd September), the Chancellor’s mini-budget unveiled the biggest tax cuts for 50 years, including a stamp duty cut for home-movers in England and Northern Ireland.

This has resulted in a lot of speculation about how these cuts might impact the UK’s finances. The value of the pound has seen record falls, which is likely to drive inflation up further. As a result, it’s widely believed that the Bank of England may need to raise interest rates faster and higher than previously forecasted. 

At the minute, there’s a suggestion from the financial markets that the bank base rate could rise to 5.8% by next spring. This has impacted the underlying costs of fixed-rate mortgages. This is why some lenders have repriced deals and others have temporarily removed some or all of their products. Some of the lenders who have withdrawn products are expected to return with new deals in the coming days and weeks.

How might increasing interest rates affect my mortgage?

If you’re a first-time buyer, moving home, or remortgaging, it’s likely you’ll be impacted by the changes. If you have a fixed-rate deal, the good news is that it will be business as usual, and your monthly repayments won’t change, at least until your current deal ends. 

If you don’t do anything, at the end of your deal you’ll automatically move on to the lender’s Standard Variable Rate (SVR). These rates tend to be higher than other mortgage rates and are generally changed to reflect movements in the Bank of England’s base rate. 

Take a look at how your repayments would change if you have a 25-year mortgage term and are looking at a fixed-rate for £200,000, based on rates increasing from between 2% to 6%. 

Fixed mortgage rate (£200,000 over 25 years) Monthly payments Increase in monthly payments
1% £754
2% £848 +£94
3% £948 +£194
4% £1,056 +£302
5% £1,169 +£415
6% £1,289 +£535


If you’re among the estimated 15% of borrowers with a variable or a tracker mortgage, your monthly outgoings will almost certainly go up. The interest rate paid on tracker mortgages is usually anchored against the bank base rate plus a set percentage. For example, the current base rate of 2.25%, plus 1%, would mean you’d be paying 3.25% interest right now. 

Can I still get a fixed-rate mortgage deal now?

Some lenders have withdrawn their fixed-rate products, while others have increased their prices in response to the rapidly changing costs of their funding. But it’s definitely worth finding out what your options are. 

If you’re on a tracker or a variable mortgage, you could shop around to see if you can find a cheaper option with a fixed-rate mortgage. However, you might have to pay an early repayment charge first. You could speak to a qualified mortgage broker or adviser if you’re unsure which options would be best for your individual circumstances. 

I’m on a fixed rate, what are my options when my deal ends?

If your fixed-rate deal is due to end within the next six months, you could see what your options are for locking in a deal now. 

Many lenders will allow existing customers to apply for new deals up to six months before their current rate ends without having to pay an early repayment charge. This is often called ‘product transfer’ or ‘switching’. This is a relatively easy process as you’re staying with your existing lender, so you won’t need a solicitor or a property valuation, and there’s no need to prove your income. 

If you’re looking to move lenders – whether you’re remortgaging or moving home – you may want to start well before your fixed-rate deal ends, as the application process can take several months or more. 

There is so much fluctuation in the mortgage market right now, you might want to look at what your lender has to offer or speak to a mortgage broker to find out which deals are available to you. 

Posted on

Property to crash in 2022?

Property to crash in 2022

Property to crash in 2022?


HOUSE PRICES have hit dizzying highs despite the UK’s crumbling economy and many now expect a full-blown crash this year. Yet a house price crash may be averted for a surprising reason.

As the cost-of-living crisis intensifies the doom-mongers are shouting about the dangers of a property crash again. Yet there are good reasons why that may not happen despite today’s growing uncertainties.

There are good reasons to be worried about the property market right now.

The average homeowner with a £224,000 mortgage is paying £1,000 a year more interest a year as result of the BOE hiking rates from 0.1 percent in December to one percent today.

Base rates are set to climb higher and many homeowners will struggle as every other household cost soars at the same time.

Banks and building societies are already marking down properties during mortgage surveys, knocking £20,000 or £30,000 off the valuation to protect themselves.

That makes it harder for borrowers to raise the money they need, forcing some to pull out of their purchase. Property chains could collapse as a result.

It’s undoubtedly a dangerous time for the housing market.

This had led to growing caution among buyers, sellers and lenders, according to the Royal Institute of Chartered Surveyors.

Estate agents report having to do a lot more legwork for sales, as prospective buyers take their time, Hargreaves Lansdown’s senior personal finance analyst Sarah Coles said.

Sources report that buyers are finding it harder to get mortgages, as lenders tighten affordability criteria. “This is causing some chains to fall apart, as many banks don’t think properties are worth their asking price,”

By every rational measure, today’s dizzying house prices should crash back to earth. The average property now costs an incredible 9.1 times the average salary in England, way above the long-term figure of four or five times.

First time buyers are struggling to build big enough deposits. Seven in 10 have now put their plans on hold for at least two years, Nationwide reports.

So why won’t prices crash?

One reason is that buyer demand is still strong, while the supply of property is weak.

House prices jumped an incredible 10.8 percent in the last year, which includes a rise of 1.1 percent in April alone, adding £3,078 to the average home.

This has lifted the average property price to another new record high of £286,079, and Halifax managing director Russell Galley said activity shows “little sign of abating” amid strong buyer competition.

Demand continues to outpace supply due to the “insufficient number of new properties coming onto the market”.

Galley anticipates the rate of house price growth will slow, but only by the end of this year. He does not foresee a crash.

Another reason the market won’t crash is that owners are taking action to protect themselves from mortgage hikes, said Joshua Elash, director of property lender MT Finance. “They are increasingly locking into longer term fixed rates, in expectation of further rate rises.”

Also, mortgages remain dirt-cheap by historical standards. It is still possible to get a five-year fixed rate charging just 2.5 percent. When property prices crashed 20 percent between 1989 and 1993, mortgage rates hit a staggering 15 percent.

That would trigger the mother of all meltdowns today, but that isn’t going to happen.

Here’s the most unexpected reason why prices won’t crash.

If the UK is heading into recession, the Bank of England is likely to scale back its base rate hikes, said Rupert Thompson, investment strategist at Kingswood.

As a result, base rates may only climb to just 1.5 percent or two percent, still low by most standards.

This would keep mortgages affordable, and head off any crash. Incredibly, this means a recession could actually ride to the property market’s rescue. Few will have seen that coming.

There is also the fact that only around one third of properties in the UK are occupied by mortgage payers, the other third are owned outright with the remainder being rented. Of the third that pays a mortgage, many are on fixed term deals, with a few having fixed deals for five or ten years. The immediate effect will probably only be felt in the next year or two, until the rises in energy this year, which account for about 75% of the inflation figure, taper off.

There is a great possibility that interest rates will rise to as much as 2.5% by next year, though nothing is certain, then they will peak and gradually come down. The fact that there are some great long term fixed rates, indicates that those in the know, are confident that the rise in rates is only temporary, hence the reason they are offering to lock in good rates (for them) for a long time.

Another factor that differentiates the current climates from the pas, is the supply of money. Since the crash of 2008, banks have not only been super careful with lending, but the gap, between the base rate and the variable mortgage rate has been higher than ever.

Previously, the gap was around 1% at the most, but for much of the last 14 years, the base rate has been around 0.5% but the variable rate has been as much as 5%, which is a mark up of 1,000% and since the pandemic, when the base rate was lowered to 0.1%, some lenders were still charging a variable rate of 5%, that is a mark up of 5,000%! So as you may gather, the banks are awash with money and the availability of funding, will invariably keep the market safe.

It seems like the doom-mongers may have to wait a little longer for the big crash.


Posted on

Property 115% more likely to sell in April

Property 115% more likely to sell in April

The chance of a vendor selling a property is at its highest level for a decade, research claims.

The continuing imbalance between supply and demand meant that properties sold faster and more easily in April.

Propertymark’s latest member data showed that while the average percentage of stock sold in April over the past 10 years is 20%, it hit 43% this year – a 115% rise.

The trade body’s Housing Market Report found there were nine sales agreed on average per member branch in April compared to the December low of only five.

This figure is lower than the peak of 14 sales per branch during the stamp duty holiday of 2020–21.

However, Propertymark said it is in line with the long-term average for April of eight sales per member branch.

The average number of properties for sale per member branch remained low in April at 20, while demand remained high at 100 house hunters per branch.

This contributed to 39% of respondents stating that most sales agreed in April were above asking price, according to the report.

Nathan Emerson, chief executive of Propertymark, said: “With fewer properties available to buy, it wouldn’t be illogical to assume that estate agents would be witnessing less sales being agreed.

“However, the number of sales agreed remains steady when compared with long term trends and agents report that sellers were 115% more likely to sell their home in April.

“This is due to the desire to buy a home remaining strong, and although the heights of prices being achieved may well start to cool, this trend is unlikely to change by a great deal.”

Posted on

Bedfordshire Market Update April 2022

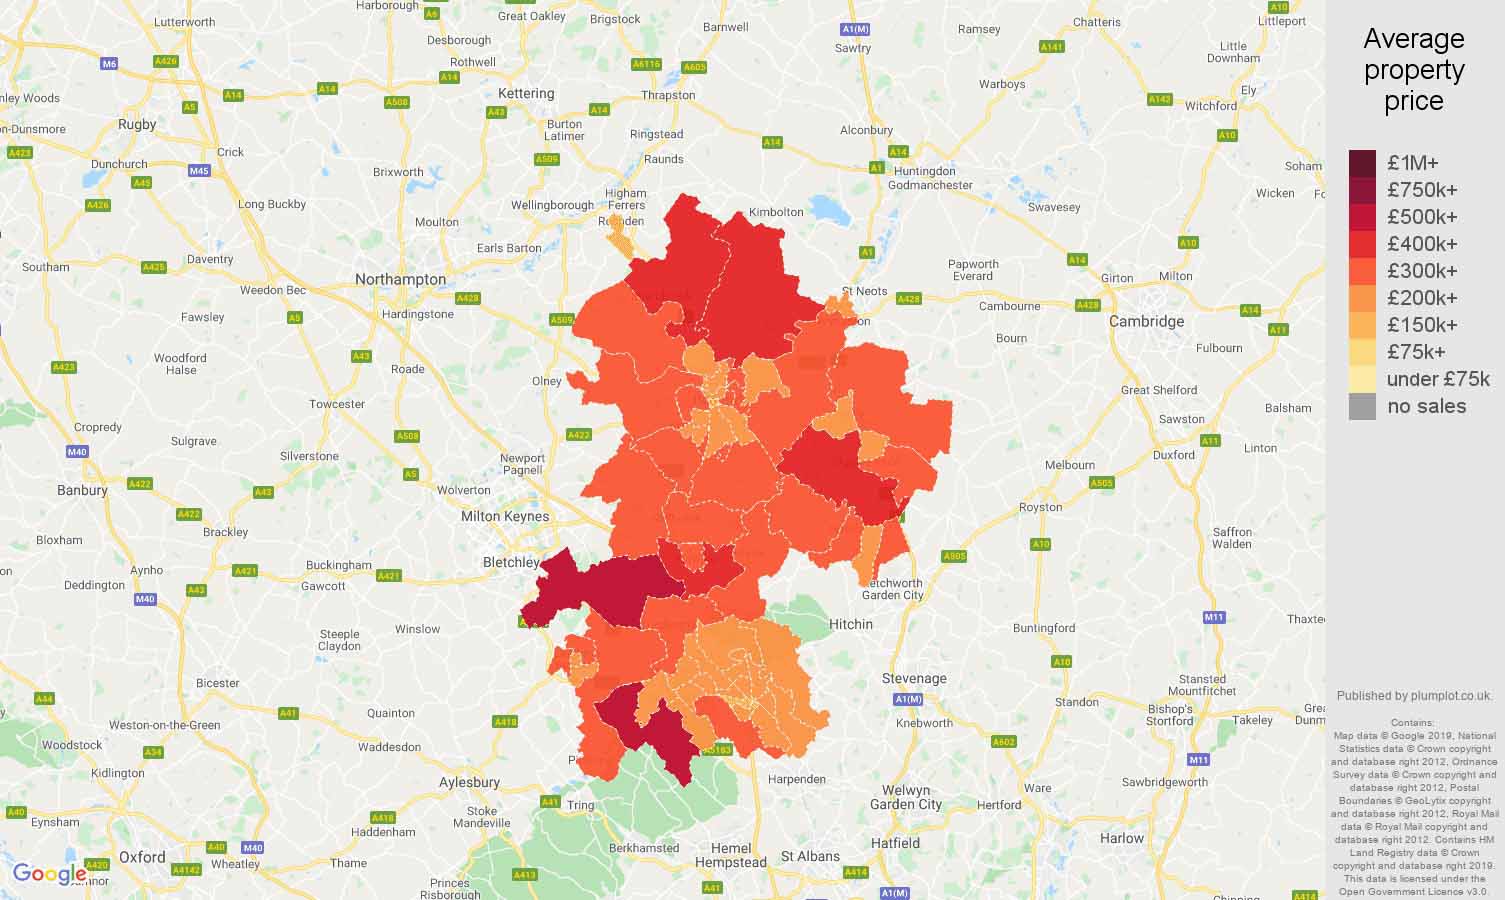
Bedfordshire House Prices- Map

Bedfordshire Market Update April 2022

An overview of the property market in Bedfordshire


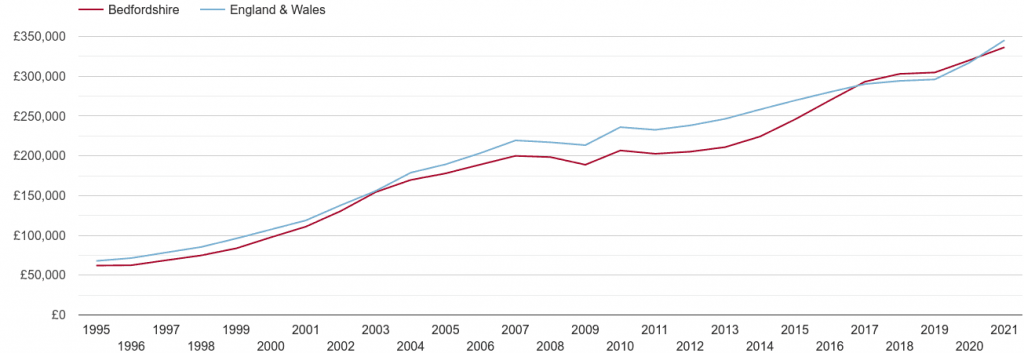
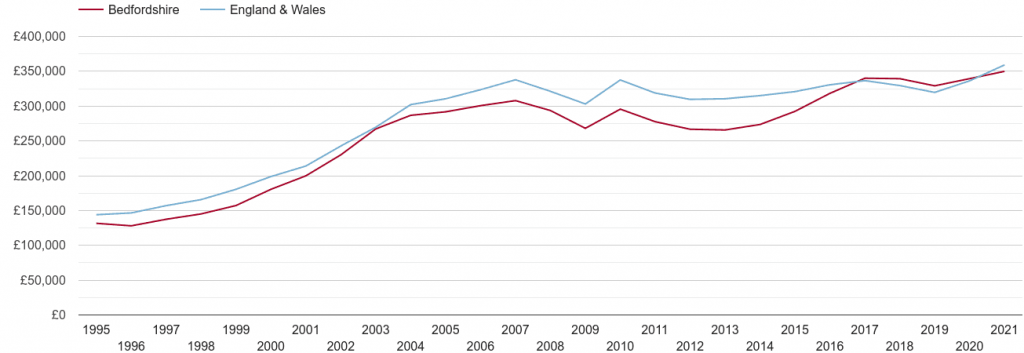
Properties in Bedfordshire had an overall average price of £340,159 over the last year. The majority of sales in Bedfordshire during the last year were semi-detached properties, selling for an average price of £326,370. Terraced properties sold for an average of £269,621, with detached properties fetching £501,950. Overall, sold prices in Bedfordshire over the last year were similar to the previous year and 8% up on the 2019 peak of £314,356.

This unprecedented price level is being stoked by the greatest imbalance between buyer demand and the number of properties available for sale that we have ever measured at this time of year. This is the strongest spring sellers’ market that we have ever seen in several metrics. Tim Bannister, Rightmove’s Director of Property Data comments: “There’s a hat-trick of reasons for home-owners to follow the normal trend and make it their goal to sell this spring. Firstly, the potential to achieve a record price for their property.

“Secondly, the imbalance between high buyer demand compared to low available property supply is the greatest that we have ever seen for the start of a spring market, meaning that the chance of being able to pick and choose between several suitable buyers is strong. Thirdly, the proportion of properties finding a buyer within the first week is also at an all-time high for this time of year, so sellers with an appropriately priced and well-presented property can expect a shorter marketing period than the norm. Those who weren’t ready to take advantage of last year’s rush now have another chance to get on the market while these conditions last.”

There are now more than twice as many buyers as sellers active in the market, which is the biggest mismatch between supply and demand that we have ever recorded at this time of year. The speed of the market is further demonstrated by the fact that are there more than one in five (22 per cent) deals being agreed on Rightmove within the first week of being marketed.

This is double the figure for the same period in the more normal market of 2019. Almost half, 47 per cent, are having a sale agreed within the first fortnight, another indicator of high demand and the likelihood of finding a buyer quickly. While these unprecedented numbers are helping to drive prices to new records, they do also show that there are a number of properties that will remain on the market after this time and that may benefit from a price reduction.

BEDFORDSHIRE ENGLAND & WALES
£334,000 – Average Property Price £342,000 – Average Property Price
2% – Average Percentage Change 5% – Average Percentage Change
 £6,700 – Average Percentage Change £15,800 – Average Percentage Change


PROPERTY TYPE OTM SSTC % SSTC AVAILABLE % AVAILABLE
ALL 7,524 5,218 69.35% 2,306 30.64%
HOUSES 5,235 3,841 73.37% 1,394 26.62%
FLATS 1,699 987 58.09% 712 41.90%
BUNGALOWS 476 323 67.85% 153 32.14%
LAND 67 45 67016% 22 28.20%
COMMERCIAL PROPERTY 177 118 54.12% 89 32.83%


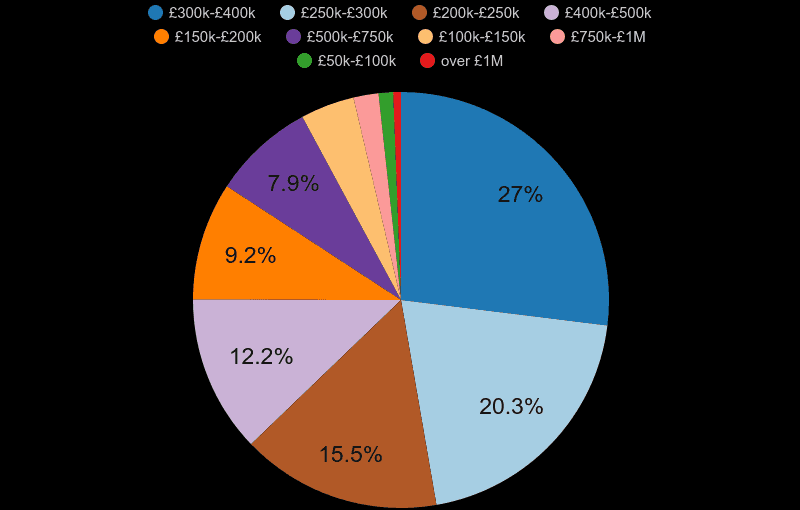
Bedfordshire-property-sales-share-by-price-range


Bedfordshire-real-house-prices

Bedfordshire-real-house-pricesCOMMENT

The Bedfordshire property market, whilst not the most active in the country, seems to be benefiting from sustained growth, with very little evidence that this will change. This is very good for confidence, which adds to the sustainability of the growth.

Posted on

Northampton Property Prices

Northampton-house-prices-map

Northampton Property Prices

An overview of property prices in Northampton

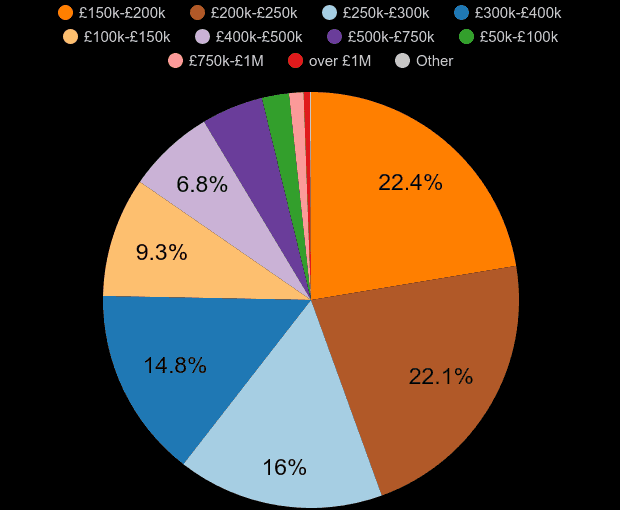
The average property price in Northampton postcode area is £275k. The average price increased by £13.8k (5%) over the last twelve months. The price of an established property is £274k. The price of a newly built property is £306k. There were 9.8k property sales and sales increased by 1.3% (139 transactions). Most properties were sold in the £150k-£200k price range with 2197 (22.4%) properties sold, followed by £200k-£250k price range with 2171 (22.1%) properties sold.


February 2021 – January 2022

Northampton postcode area

England and Wales

£275k

average property price

£343k

average property price

5%

average price percentage change

7%

average price percentage change

£13.8k

average price change

£21.1k

average price change

Northampton house prices map

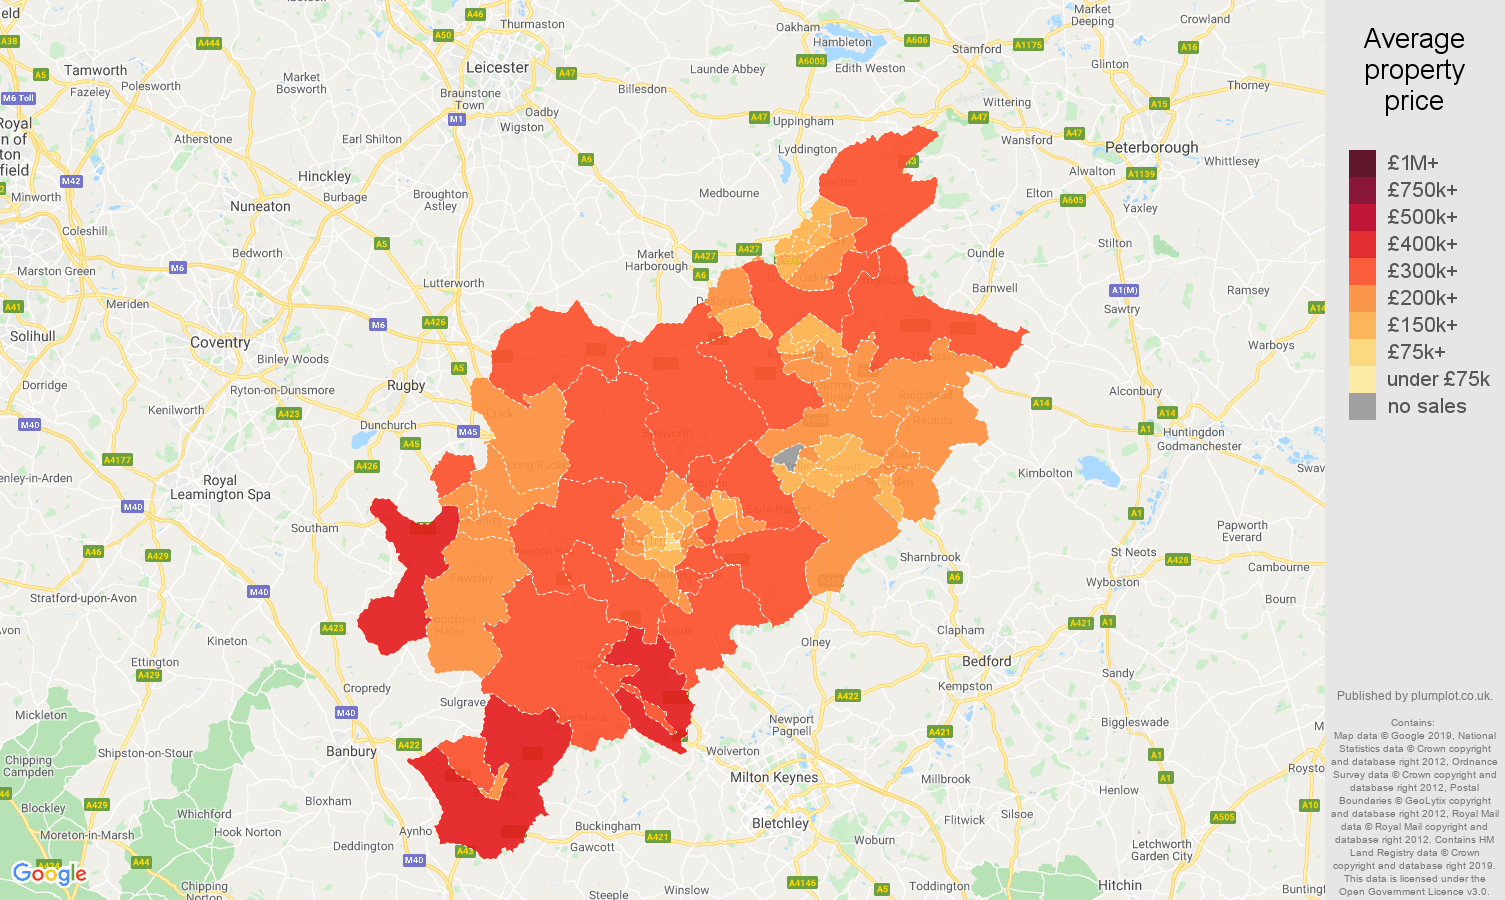
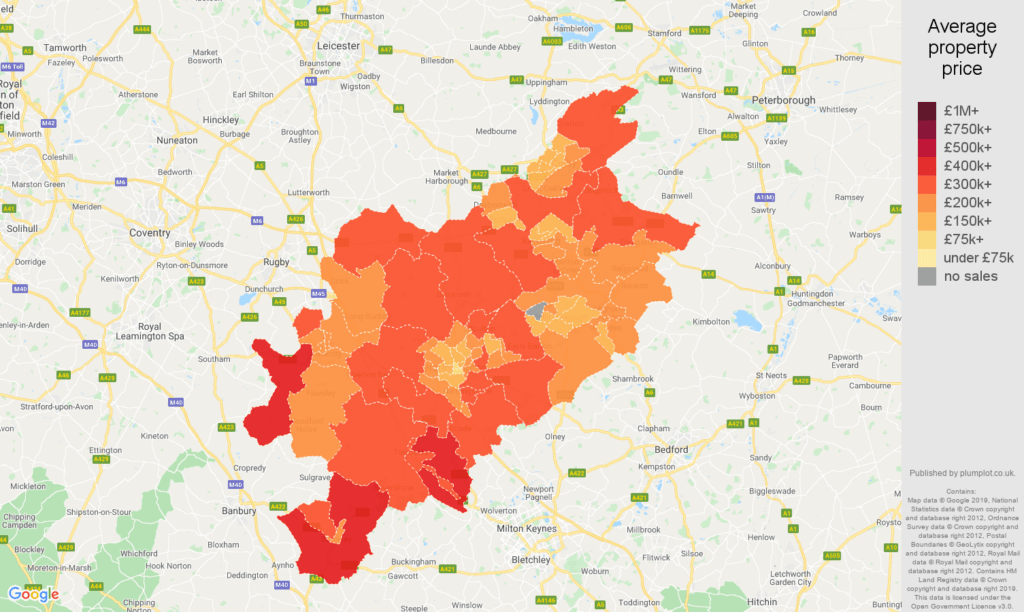
This price map shows the average property price in a given postcode sector between February 2021 – January 2022. The most affordable place was ‘NN1 2’ with the average price of £148k. The most expensive place was ‘NN11 5’, £520k.

Northampton house prices compared to other areas

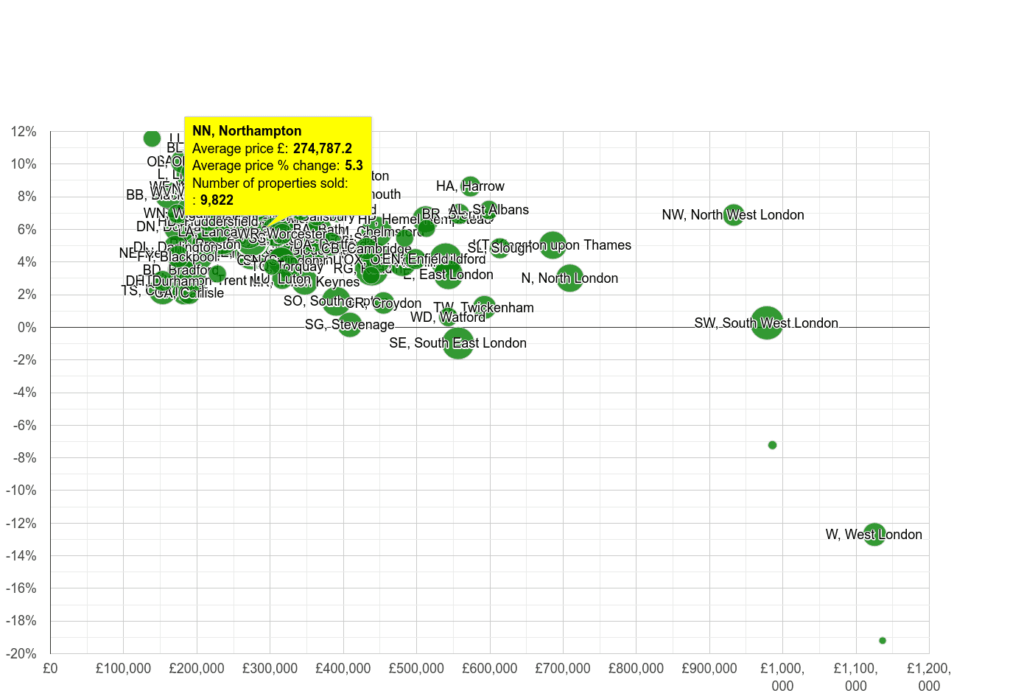
Comparison of the average property price and an average price percentage change by postcode area. Price % change compares the average property price between February 2021 – January 2022 to the average price in the previous 12 months. The size of the circle shows the number of property transactions. The bigger the circle the higher the sales volumes in postcode area.

Northampton house price rank

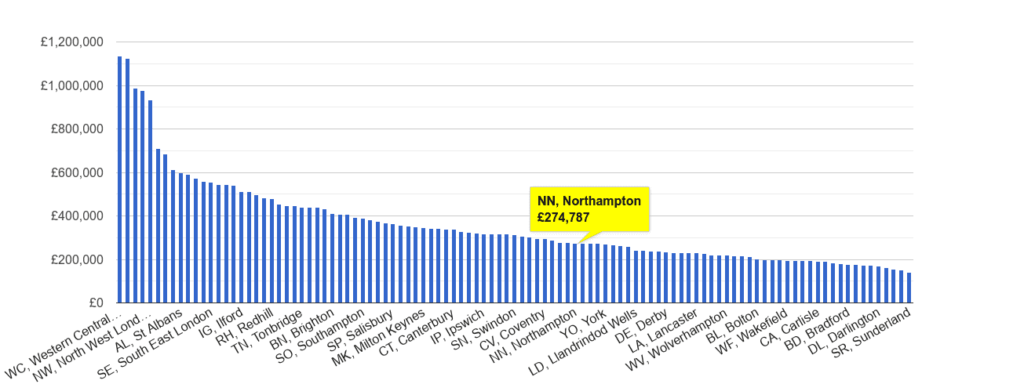
With the average price of £275k, Northampton is the 45. cheapest postcode area out of 105 England and Wales’ postcode areas.

Northampton property sales share by price range

shows a number of properties sold in a given price range between February 2021 – January 2022.


Property price range Market share Sales volumes
 under £50k 0.1% 9
 £50k-£100k 2.1% 207
 £100k-£150k 9.3% 915
 £150k-£200k 22.4% 2.2k
 £200k-£250k 22.1% 2.2k
 £250k-£300k 16.0% 1.6k
 £300k-£400k 14.8% 1.5k
 £400k-£500k 6.8% 666
 £500k-£750k 4.8% 471
 £750k-£1M 1.1% 111
 over £1M 0.5% 47


If you would like a free market appraisal and wish to know more about our unique discreet marketing, contact Northamptonshire Luxury Homes via the contact form below.

Posted on

The top ten most expensive streets in Northampton

The top ten most expensive streets in Northampton

The top ten most expensive streets in Northampton

Each of the properties seen here make the average Northampton house price of £295,397 look small

Northampton’ s ten priciest streets to buy a home on have been revealed after home sales specialists Property Solvers compared the numbers.

Looking at streets that have sold three or more properties since 2016, the company tracked average sold price data from HM Land Registry to see where the highest and lowest-priced homes are located across the NN1, NN2, NN3, NN4, NN5, NN6 and NN7 areas.

After Mojo Mortgages’ data revealed that Northampton is in the top 50 least affordable places for first-time home buyers, this new data shows the heights that some properties’ prices have risen to.

Golf Lane, Mears Ashby Road and Rugby Road took up gold, silver and bronze respectively. But individual properties also stood out.

Commenting on the data, Property Solvers co-founder Ruban Selvanayagam said: “To keep the data less skewed, we only ranked the streets that had over three sales.

“It’s therefore worth noting that, in recent years, a property on Welford Road (NN6) sold for £1,750,000 and, at the other end of the market, there were properties that sold for £72,500 and under on Nethermead Court (NN3), Harlestone Road (NN5) and St. Lawrence Court (NN6).”

Read on for the full rankings and prices of Northampton’s most expensive streets.

1. Golf Lane, Church Brampton, NN6

Coming in with an average sale price of £1,277,500 across four houses sold, Golf Lane only just nabbed the top spot, with two other contenders not far behind. The lane feeds on to Northamptonshire County Golf Club and sits just south of Brampton Stables.

2. Mears Ashby Road, Earls Barton, NN6

Taking second place with three houses sold at an average price of £1,125,000, this road was just narrowly pipped to the post by Northampton’s leading lane. Sitting just outside of Earls Barton, each property has an unlimited view of the large fields in front of them, as well as close connections to the town.

3. Rugby Road, Harleston, NN7

In third place comes Rugby Road, after selling three houses for an average of £1,100,000. The road connects into Kilsby and runs parallel with the M45. It also sits just south of the Royal Mail’s National Distribution Centre

4. North Street, Mears Ashby, NN6

Coming in fourth with an average sales price of £1,038,333 across three houses sold, North Street sits South East of Sywell Aviation Museum. It is also within a stone’s throw of the Whichwood Cat Hotel.

5. Sandy Lane, Church Brampton, NN6

Featuring as the Church Brampton area’s second appearance in Northampton’s most expensive properties, Sandy Lane’s houses cost an average of £1,008,750 across four houses sold. The street runs to the north and west of Northamptonshire County Golf Club.

6. Turnberry Lane, Collingtree, NN4

At an average £920,160 split across five houses sold, Turnberry Lane is the first in the rankings to fall a bit below the £1 million price tag. The land leads right on to Collingtree Park Golf Club and sits just south of Far Cotton.

7. Church Road, Spratton, NN6

With four properties sold at an average of £897,500, Church Road runs alongside St Andrew’s Church and lies to the West of Brixworth across many rolling fields

8. Moulton Lane, Boughton, NN2

Costing and average of £887,833 across three houses sold, Moulton lane is wrapped in large, open fields. One end leads to a popular English Heritage site, being the ruins of St. John’s Church, while the other meets Boughton Primary School.

9. Foxhill Road, West Haddon, NN6

Pulling in an average of £875,432 across three houses sold, Foxhill Road begins just outside of West Haddon proper and sits due north on Long Buckby, to which the road leads directly.

10. Church Hill, Ravensthorpe, NN6

Taking up tenth position at an average cost of £867,500 between three properties sold, Church Hill is yet another street sharing space with a church, this time St Denys’, and sits not far from Cotton Manor Gardens and just to the northeast from Long Buckby

If you would like a free market appraisal and wish to know more about our unique discreet marketing, contact Northamptonshire Luxury Homes via the contact form below.

Posted on

Northampton named in top 5 UK property demand hotspots

Northampton named in top 5 UK property demand hotspots

Northampton named in top 5 UK property demand hotspots

Northampton has been named in the top five UK National Hotspots Index for the last quarter.

The latest Property Hotspots Index, produced by eMoov.co.uk, records the change in supply and demand for the most populated locations across the UK, by monitoring the total number of properties sold in comparison to those on sale.

The latest research found that national property demand has increased by +3% overall since Q1, now at 40%. But it’s not good news for homeowners in the capital, with demand in London as a whole down -2% to 39%.

Despite demand cooling across the capital, the London Borough of Bexley remains the hottest spot in the UK for property demand. At 71%, demand for property in Bexley is the highest across the UK, although it has cooled by -7% since the start of the year in line with the decrease felt across the capital as a whole.

Bristol is still the hottest spot outside of the London bubble, with demand increased, albeit marginally, to 69%. Nearby Bedford (67%) also retains its place as the third hottest spot in the UK as commuter zones around the peripherals of the London bubble continue to grow in popularity, due to the inflated price of homeownership in the capital.

And Northampton has seen the biggest percentage rise in demand (up 10%) in the entire country, climbing to joint fourth hottest spot in the UK with Aylesbury on 64%.

Northampton replaced nearby Milton Keynes (15th) in the top.

Founder and CEO of eMoov.co.uk, Russell Quirk, said Brexit scaremongering has not been justified.

“National demand is still lower than the levels seen at the back end of last year and the big decider on which way it goes now will be Britain’s choice to leave the EU,” he said

“There has been a lot of talk about the consequence of this vote on the UK property market with many forecasting a detrimental impact on house prices.

“We don’t believe this to be the case and I’m certain that come Q3, our index will show a further increase in property demand across the nation.”

Posted on

Northampton house prices continue to rise

Northampton house prices continue to rise

Northampton house prices continue to rise

Property rose by 0.5 percent more expensive than in February, new figures show.

The boost contributes to the longer-term trend, which has seen property prices in the area achieve seven percent annual growth.

The average Northampton house price in March was £225,681, Land Registry figures show – a 0.5% increase on February.

Over the month, the picture was less good than that across the East Midlands, where prices increased 1.9%, and Northampton underperformed compared to the 1.8% rise for the UK as a whole.

Over the last year, the average sale price of property in Northampton rose by £15,000 – putting the area 40th among the East Midlands’s 45 local authorities for annual growth.

The best annual growth in the region was in Oadby and Wigston, where property prices increased on average by a whopping 21 percent, to £275,000. At the other end of the scale, properties in East Northamptonshire gained 3.1 percent in value, giving an average price of £257,000.

Winners and Losers

Owners of terraced houses saw the biggest improvement in property prices in Northampton in March – they increased 0.8 percent, to £192,588 on average. Over the last year, prices rose by 7.9 percent.

Among other types of property:

■ Detached: up 0.5 percent monthly; up 7.9 percent annually; £388,929 average

■ Semi-detached: up 0.3 per cent monthly; up 6.7 per cent annually; £232,200 average

Flats: up 0.4% monthly; up 3.7% annually; £130,191 average

First steps on the property ladder

First-time buyers in Northampton spent an average of £199,000 on their property – £13,000 more than a year ago, and £40,000 more than in March 2016.

By comparison, former owner-occupiers paid £250,000 on average in March – 25.3 percent more than first-time buyers.

How do property prices in Northampton compare?

Buyers paid 2.6 percent more than the average price in the East Midlands (£220,000) in March for a property in Northampton. Across the East Midlands, property prices are lower than those across the UK, where the average cost £256,000.

The most expensive properties in the East Midlands were in Rutland – £362,000 on average, and 1.6 times as much as in Northampton. Rutland properties cost 2.4 times as much as homes in Bolsover (£149,000 average), at the other end of the scale.

The highest property prices across the UK were in Kensington and Chelsea, where the average March sale price of £1.3 MILLION could buy 14 properties in Burnley — where the average is £94,000.