Posted on

Buckinghamshire Market Update April 2022

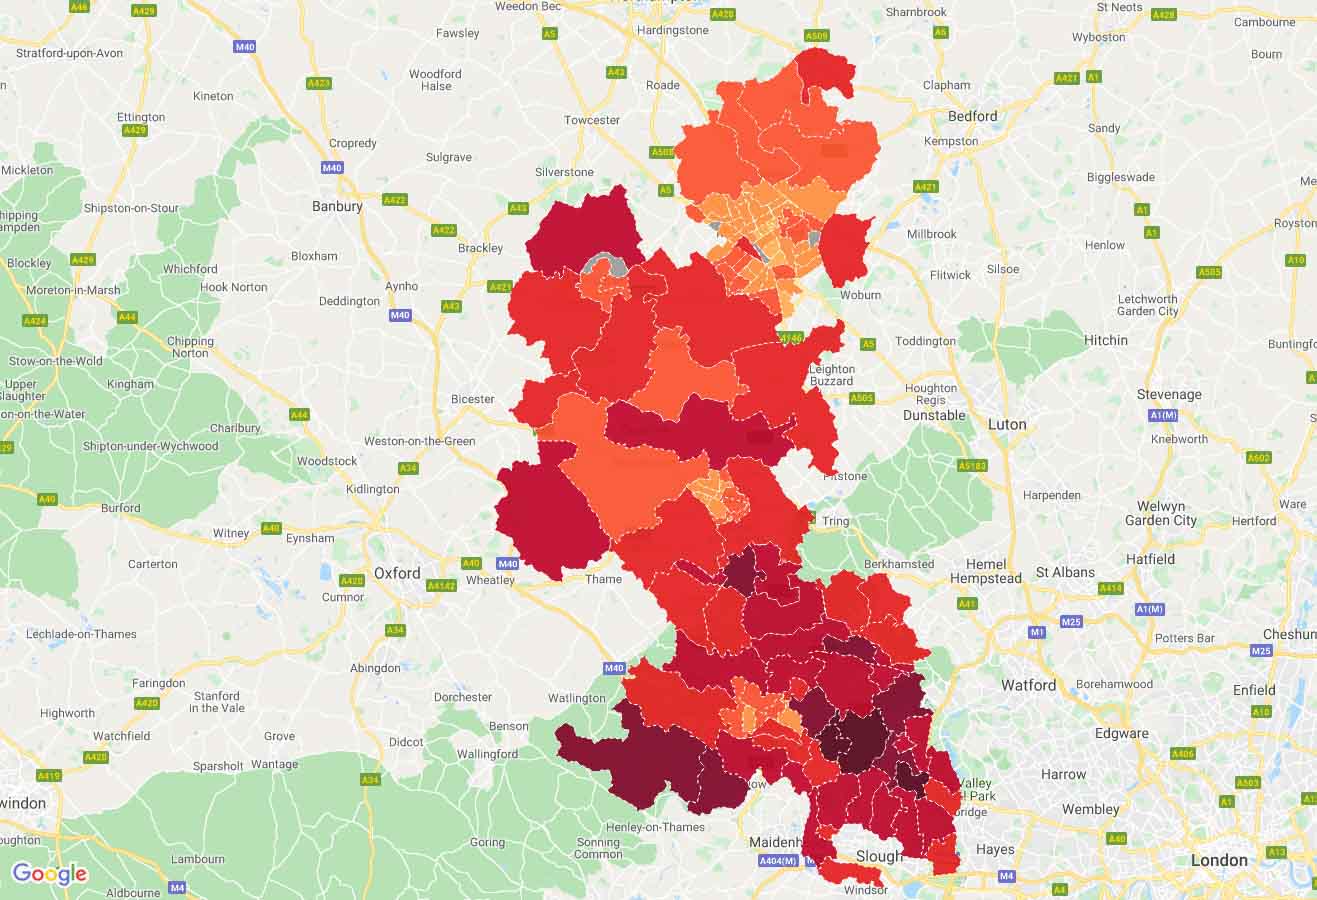
Buckinghamshire Market Update by Trellows Estate Agents

Buckinghamshire Market Update April 2022

An overview of the property market in Buckinghamshire

House Prices in Buckinghamshire

Properties in Buckinghamshire had an overall average price of £490,185 over the last year.

The majority of sales in Buckinghamshire during the last year were detached properties, selling for an average price of £786,120. Semi-detached properties sold for an average of £410,991, with terraced properties fetching £328,527.

Overall, sold prices in Buckinghamshire over the last year were 5% up on the previous year and 16% up on the 2019 peak of £422,735.

House prices increased by 0.7% – more than the average for the South East – in Bucks, new figures show.

The boost contributes to the longer-term trend, which has seen property prices in the area achieve 9.4% annual growth.

The average Buckinghamshire house price was £447,579, Land Registry figures show – a 0.7% increase on October.

Over the month, the picture was similar to that across the South East, where prices increased 0.5%, but Buckinghamshire underperformed compared to the 1.2% rise for the UK as a whole.

Over the last year, the average sale price of property in Buckinghamshire rose by £38,000 – putting the area 38th among the South East’s 64 local authorities with price data for annual growth.

The best annual growth in the region was in Hastings, where property prices increased on average by 22.4%, to £276,000. At the other end of the scale, properties in Woking gained just 3.7% in value, giving an average price of £442,000.

The new data released this week is accurate up to December.

Winners and Losers

Owners of semi-detached houses saw the biggest improvement in property prices in Buckinghamshire – they increased 0.8%, to £440,633 on average. Over the last year, prices rose by 10.1%.

Among other types of property:

Detached: up 0.8% monthly; up 11.8% annually; £820,452 average

Terraced: up 0.5% monthly; up 7.2% annually; £342,687 average

Flats: up 0.4% monthly; up 5.8% annually; £235,246 average

First steps on the property ladder

First-time buyers in Buckinghamshire spent an average of £330,000 on their property – £26,000 more than a year ago, and £38,000 more than in November 2016.

By comparison, former owner-occupiers paid £534,000 on average in November – 61.7% more than first-time buyers.

How do property prices in Buckinghamshire compare?

Buyers paid 21.3% more than the average price in the South East (£369,000) in November for a property in Buckinghamshire. Across the South East, property prices are high compared to those across the UK, where the average cost £271,000.

The most expensive properties in the South East were in Elmbridge – £692,000 on average, and 1.5 times as much as more than in Buckinghamshire. Elmbridge properties cost three times as much as homes in Southampton (£233,000 average), at the other end of the scale.

The highest property prices across the UK were in Kensington and Chelsea.

Factfile

Average property price in November

Buckinghamshire: £447,579

The South East: £369,093

UK: £270,708

Annual growth to November

Buckinghamshire: +9.4%

The South East: +9.6%

UK: +10%

Best and worst annual growth in the South East

Hastings: +22.4%

Woking: +3.7%

Posted on

Central London Market Update April 2022

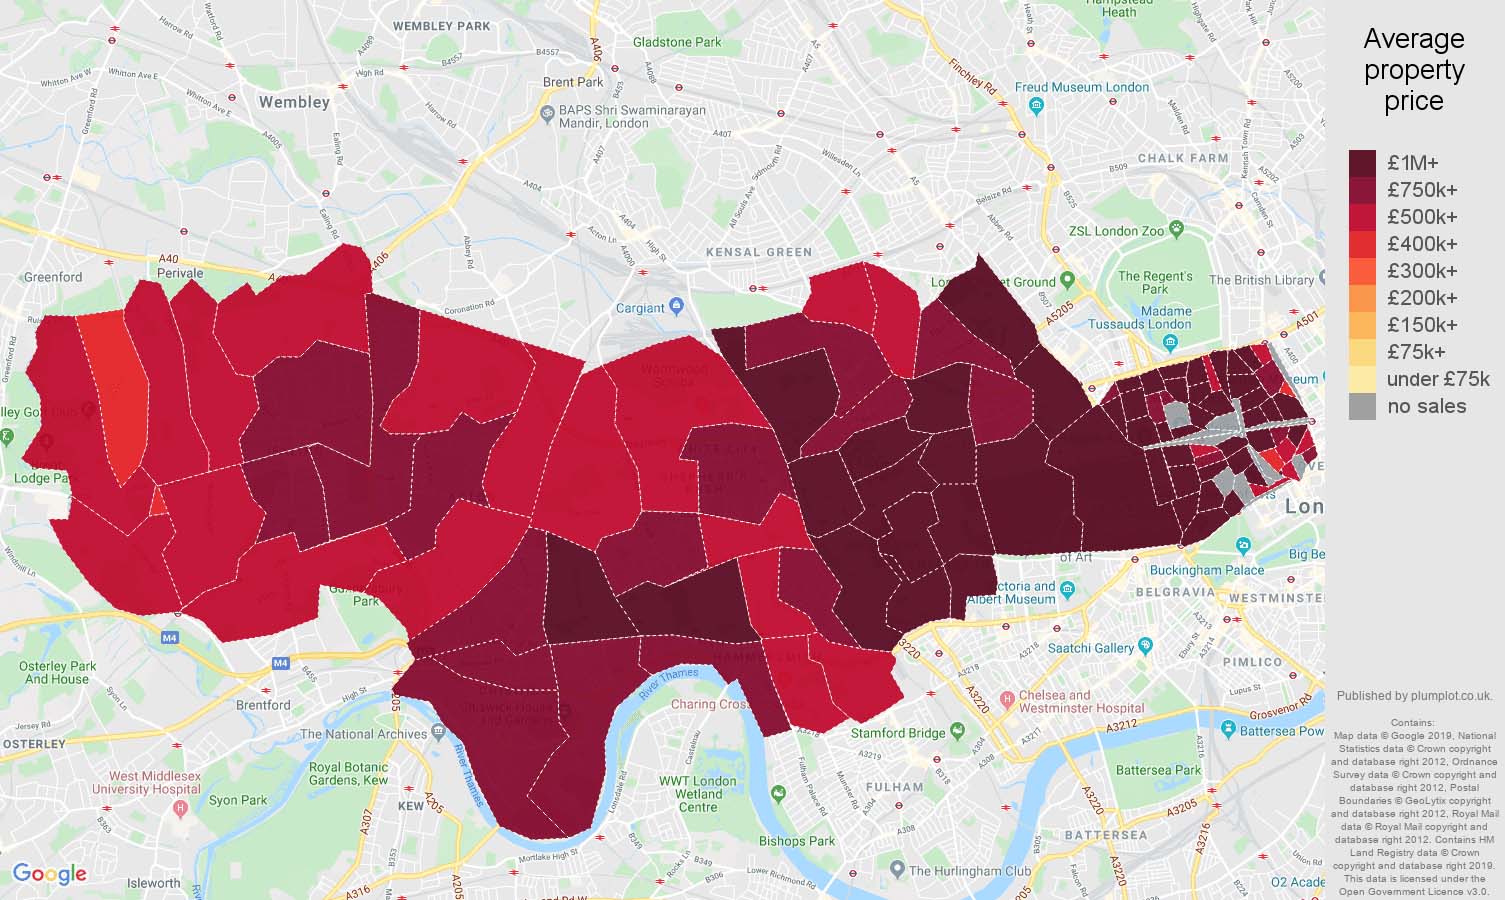
West London house prices map

Central London Market Update April 2022

The state of the market in Central West London


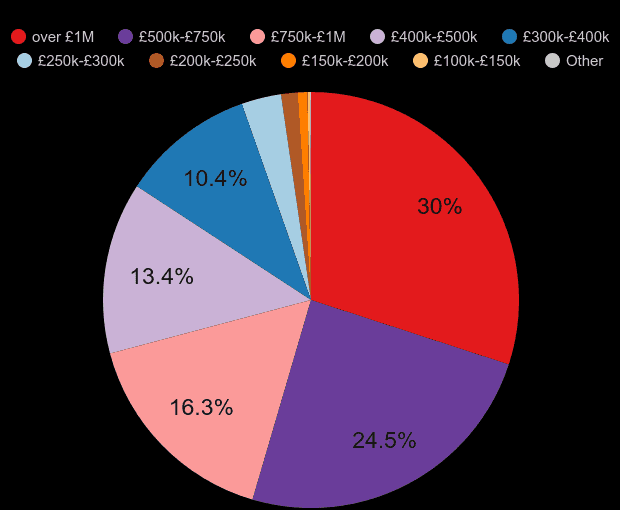
The average property price in West London postcode area is £1.1M. The average price declined by £-190.1k (-14%) over the last twelve months. The price of an established property is £1.2M. The price of a newly built property is £702k. There were 5.5k property sales and sales increased by 9.2% (497 transactions). Most properties were sold in the over £1M price range with 1650 (30.0%) properties sold, followed by £500k-£750k price range with 1348 (24.5%) properties sold.

West London postcode area England and Wales
£1.1M £342k
average property price average property price
-14% 5%
average price percentage change average price percentage change
£-190.1k £15.8k
average price change average price change

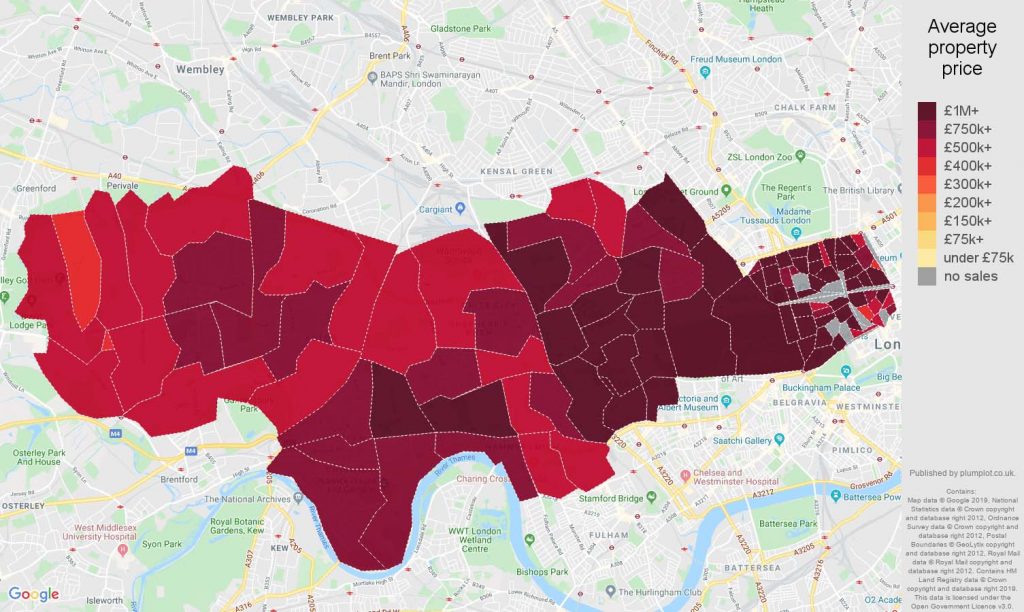
West London house prices map

West London property sales share by price range

London house prices ‘overvalued by up to 50%’

Official data for January reveals the average price fell by 1.8% to £510,102

London’s property market is “overvalued” by as much as 50% and this has raised fears of a “looming correction”, The Telegraph reported.

S&P Global Ratings, an American credit rating agency, told the paper that “a combination of low rates, the stamp duty holiday and excess savings amid the pandemic have driven property prices higher, particularly in London and the South East”. Researcher Alastair Bigley warned that prices were likely to fall. “We expect a greater correction in property prices in an overvalued market,” he said. Meanwhile, outside London, S&P estimated that property was overvalued by 20%.

According to the latest house price index issued by property website Rightmove, the average home in London now costs £664,400. And the average time it takes to sell a home in the capital dropped from 68 days to 57 days in February – “another sign activity is picking up”, said the London Evening Standard.

Rightmove’s data also revealed that the UK house price average is now £354,564 – the first time it has exceeded £350,000.

Property prices fell by 1.8% in January

The average property value in London was £510,102 in January 2022 – down 1.8% from December 2021, according to official data published by the HM Land Registry and the Office for National Statistics (ONS).

Regional data from the house price index revealed that London saw the lowest annual price growth, an increase of 2.2%, and the 1.8% dip was the most significant monthly price fall.

The London property market is one of the most robust markets in the world. The market is still being affected by a combination of factors that will take a long time to balance out.

Firstly there was Brexit, which resulted in less demand for housing in the capital, as many companies and workers either put their plans on pause, pending a clearer picture of how leaving the EU will change things, then there was the lockdown, a once in a lifetime event that came out of nowhere, forcing companies to switch to a work from home policy that changed the demographics significantly and with many workers still not travelling in to work, the city is still not back to normal.

Another consequence of the lockdown, was the number of EU workers who decided to leave, figures suggest that this may have been up to one million in London alone. This was then followed by constant uncertainly about the pandemic and to top it all, February the 24th saw the invasion of Ukraine by Russia, which has resulted in a significant fall in investment from the Russian market as sanctions were imposed. This happening at the same time as high inflation caused by the bounce-back along with the first interest rises in a long time, as the markets deal with massive price rises, due to delays in the supply of materials around the world, post-pandemic.

Despite all these factors, which are referred to as the ‘perfect storm’ London is still holding up relatively well and there will no doubt be a striking point where investors will begin to enter the market in larger numbers, placing their money in to one of the safest markets in the world.